Friday 09/06/2019 by phishnet

EPILOGUE: IDLE HANDS AND DICK'S

[We'd like to thank regular blog contributor @paulj for contributing another insightful data visualization to the blog. ICYMI: his pre-Dick's piece. - ed.]

He becometh poor that dealeth with a slack hand: but the hand of the diligent maketh rich. -- Proverbs 10:4

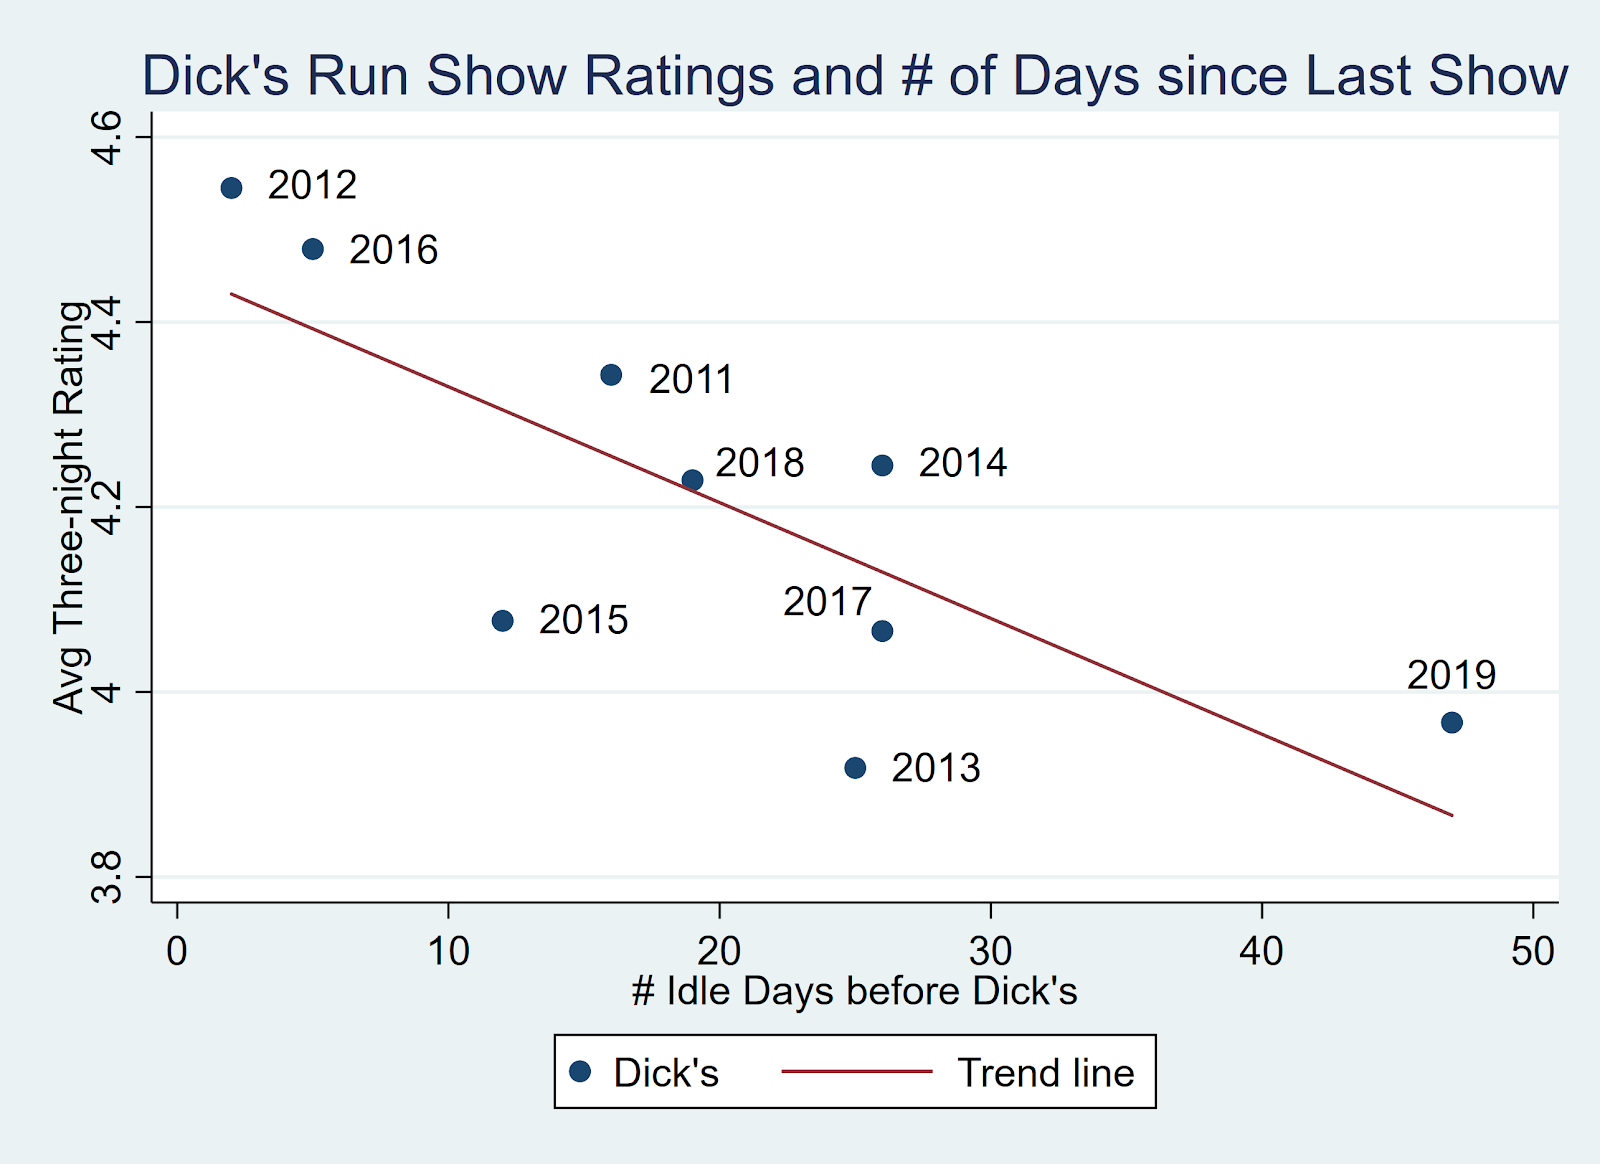
Note #1: “Idle Days” is the number of days from the last pre-Dick’s show to the first night of Dick’s. In 2019, it was 47 days from Alpine N3 to Dick’s N1.

Note #2: The average three-night rating for 2019 is based on about 425 reviewers for each show. The value used in this graph (3.967) is likely to change a bit as more people provide a rating.

If you liked this blog post, one way you could "like" it is to make a donation to The Mockingbird Foundation, the sponsor of Phish.net. Support music education for children, and you just might change the world.


Comments

, comment by Wombat_en_Fuego
Wombat_en_Fuego I love graphs and charts. We need more of them on this site, please.
, comment by officercookies
officercookies Image
, comment by Cantaloupe
Cantaloupe Excellent work! Was just talking about this with some friends and it seems my suspicions were correct—Phish needs to get back to 2-leg tours with the second leg leading them to dicks. Time for them to put family life aside and get their butts on the road.
, comment by mgolia6
mgolia6 I am all about the numbers and love data like this. Is there a way to cross reference the show ratings by those who attended and those who did not. I am assuming as someone lists in their profile what shows they have attended, this data could be extrapolated. It would be interesting to see this chart with that additional data point and check the show ratings with an overlay of attended vs not attended.

Aside from slight anomalies, this would be the expected result, i.e. more lag between performances means lower rated performances due to rust/cobwebs, etc...

Great Stuff!

p.s. i rated Saturday & Sunday a 5 and i was in attendance and particularly sober aside from some slight heat exhaustion...LOL
, comment by lysergic
lysergic Looks like rust is real, at least for Dick's performances. I would love to see this same graph but for overall phish shows, with average ratings for 1-day, 2-day, 3-day, etc. idleness periods.
, comment by MiguelSanchez
MiguelSanchez Nice work Paul.

At first glance, I thought this one had @ucpete's name written all over it.
, comment by phishphan97
phishphan97 Jeez. And my run in 2013 is lowest rated. The second nite CDT is still one of my top 10 jams
, comment by uctweezer
uctweezer @MiguelSanchez said:
Nice work Paul.

At first glance, I thought this one had @ucpete's name written all over it.
Paul is definitely a man after my own heart! But this one was all him (I did copy and paste it into the site for him though?)
, comment by jonesgator
jonesgator Yaaaaaaaaaasss. Of course, we can't expect the guys to ditch everything else to make sure that Dick's alone is perfect, but there is clear evidence that they are simply less in tune with the flow/hose in the context of a Phish show than they would be after a series of shows. The guys in Phish have their own lives and solo careers that they are also dedicated to. It's on us to enjoy the shows we get and be thankful for every note!
, comment by paulj
paulj There are very few observations here (nine) which is why I made no comments regarding statistical significance. Instead, as with most empirical work, the data allow us to document what we already know: Phish gets better as a tour goes on, and shows near the end of a tour (if not necessarily the tour closer) tend to be strong. Phish need to play together for a while before they can summon forth the magic.

Musically speaking, 2019 may not have been my favorite Dick's run, but the jamming was super solid throughout the weekend. Phish did their job well, although they didn't match the heights of previous years. That said, it's Phish@Dick's, so we got to stay with friends for the weekend, catch up with the Lot G Kansas/Iowa/Colorado crew we pre-game with every year, and I managed to talk a (nice) Adams City police officer out of busting me for public urination in Lot H. So, all in all, A GREAT RUN!
, comment by twick
twick This is awesome and accurate.
, comment by Pjfmc
Pjfmc People are really running with this. This graph doesnt prove anything. You could try to use it to support a certain hypothesis but there are too many problems with the data for an argument resting on the graph to hold any real water.

People arent rating shows based on any clear or agreed upon criterea. Some people give 1 star ratings just to bring down the ratings of shows that they think are rated too highly.

I think it would be interesting to see the data with all of the 1 and 2 star ratings removed.

The show ratings are also based on averaging integers. Can we really say that there are FOUR significant figures in an average of integer values? Every single one of these shows is essentially rated 4 stars except 2012 which you could argue is rated 5 because the band conciously decided to do something with special significance to fans in that year.

An argument could be made for three tiers, but the bottom tier is distributed all across the x axis.

As it is, even the longest gap by far does not result in a sgnificantly lower rating, it isnt even the worst rated show. The third longest gap is the 4th highest rating!
, comment by Phish21
Phish21 ... Someone explain how to upload images, they're not displaying after i submit... and I will update below to show the data I'm explaining.

Here is a comparison of all 2018 and 2019 shows, and the # of days between the last show played. I see two things.

1. There seems to be a correlation between higher day gaps and lower ratings
2. However, It's also very common for low rated shows to occur in low day gaps, and the variances to be larger.

If you plot the same shows by date (like below) it's still inconclusive to say that the show ratings trend higher as more shows accrue in a short period of time.

An interesting analysis (but not one that can be done based on available data), would be to do the same analysis based # of mistakes made by the band during songs (instead of reviews which are too subjective). I bet you would see less mistakes as the tour went on.
, comment by kayadogling
kayadogling I think this is very interesting and it sheds light, but there are some different variables to account for when reading.

Such a long layoff opens up almost all songs, which then I think they tend to "lean" on their strongest ones which is why it doesn't rate as high. There were also a lot of new songs this year since last Dicks that they wanted to showcase, which isn't what some people want to hear. Also, the graph makes 2019 appear low, but rating close to a 4 is still solid imo.

I do think them playing together closer to the shows helps and I am all for a 2-leg run of June and August again or something similar where Dicks really is the summer tour closer and not a one-off.
, comment by Moo_Phunk
Moo_Phunk Love seeing a Stata graph on .net!!

That being said I agree with the users who say this theory does not offer a whole lot of explanatory power in terms of show ratings. If we want to get economics-y with our analysis of Phish shows then we have to take it all the way. The R-squared here is probably about 0.6. Plus any power analysis where we only have 9 observations would not merit much causal interpretation. With all the data we collect as phish fans, a much more robust analysis could likely be performed on this theory. Idk if there is anything specific about Dicks that would make us want to focus ONLY on the stats for those shows. We could test the hypothesis regarding idle days on a broader cohort to try to estimate this more precisely!
, comment by Banff
Banff 2015 Phish & Dicks was the best year and shows period since they came back in 09.
, comment by Dreamer
Dreamer Looks like someone's using Minitab and working on their simple linear regression skills! What's the r-value of that trend line?
, comment by Choda
Choda Wow. Thanks for insight.
, comment by NipseySlicer
NipseySlicer @phishphan97 said:
Jeez. And my run in 2013 is lowest rated. The second nite CDT is still one of my top 10 jams

2013 IMHO is way under rated. Probably because 2012 Dick’s was peak 3.0. I think we all agree tour openers are a huge risk precisely because of rust. I was at the Mothership for the comeback because I would not be anywhere else on planet earth when Phish is playing after a hiatus such as it was. Have I ever listened to those shows again? Nope , but the love in that round room has yet to be equaled in my experience. Ratings are good and all, but we know shows are a Rorschach test in many ways, Where You At ?
, comment by NipseySlicer
NipseySlicer @Banff said:
2015 Phish & Dicks was the best year and shows period since they came back in 09.

I started seeing Phish in Burlington in ‘87. IMHO 2012 Dicks is the best three day run of 3.0 . Sunday night at Alpine was up there for best show of 3.0 and really a massive surprise for us. Kinda saw that Dicks wouldn’t surpass that with the break . But all my friends had a funky good time.
, comment by paulj
paulj @PJFMC: You will note that there are no claims to any statistical significance. This is simply a scatter plot with a trend line attached.

Your complaints about show ratings are well-founded, and have been discussed in past: attendance bias (+), recency bias (+), downrating to offset attendance and recency bias (-), people using the scale differently (i.e., compressing the scale to only two values, 4 and 5), etc. etc. I've actually got some ideas about how to overcome these problems, and will send you a PM. See below.

@MOO_PHUNK: This post arose from my interest in venue effects, which came from a larger econometric model based on 3.0-era data accounting for # songs/set, bustouts, debuts, vacuum solos, narrations, and a few other things. I'll be updating this model after the 2020 Mexico shows. PM me if you want to see it.

@PHISH21: I don't understand what you are saying; perhaps if I could see the graph I'd get what you're trying to say. PM me for my email address so that you can send the graph.

@DREAMER: it's a standard graph generated by Stata. Minitab, though...that takes me back almost three decades!

To All: I'm thinking of creating a show ratings panel of perhaps fifty respondents for the short fall tour in early December. I'd ask that participants listen to every show at least once, and then rate all seven shows during a specific time period AFTER the Fall tour but BEFORE the NYE run. This should help control for respondent fixed effects and some of the biases inherent in the .net ratings.
, comment by mgolia6
mgolia6 So I’m commenting again. I think it’s comical that the criticism comes out when someone is doing some random ad hoc analysis of phish, leisurely of course. Sure this band has spawned university level courses, but really, someone taking their own time to work out a formula with which to better understand the ratings of Dicks in clear comparison to lag time between shows is simply what this band is about and what makes me proud to be part of this community. Granted there are better statisticians than I, better number crunchers and data scientists out there but ultimately we can all agree its cool that we take our free time to utilize our skills of analysis to dissect this band.

Bravo for the thread. And bravo for the band. And I am all about adding additional criterion In order to de-subjectify (made up word) a subject that is entirely fraught with subjectivity.

I love this stuff.
, comment by jarpua
jarpua That’s a lot of Dick spots
, comment by jadedforbin
jadedforbin Meh. The band played really well this year. Several jams (Everything, Mercury, Ghost, Gin, Piper) are pretty clearly the best versions of the year so far. So basically, similar to Dicks every other year. It's pretty unreasonable to expect Dicks to have the single best show of the tour every single year (and would be quite unfair to other venues if they did this on purpose). Especially this year given Alpine 3 madness, it was never going to be THAT show, because it already went down at Alpine. Everything > Mercury especially was BOMB.COM. Ratings on this site mean less and less all the time, with people throwing out 1s and 2s just because they weren't in attendance, or want to fluff a different run. Dicks 19 was great. Camden3 was better. Alpine 3 was all-time great. Every show can't be Cam3 or Alp3. that's not how it works.
, comment by User_7198_
User_7198_ It would also be interesting to see the same graph, except with the y-axis as the difference between the average Dicks show and the average summer show. Dicks 2019 were some of the highest rated shows they played this year—it’s hard to argue “rust” when they didn’t get a lot of love for anything they played this summer, and in fact got more love for Dicks.
, comment by Capt_Tweezerpants
Capt_Tweezerpants Whats the R2 value on this @paulj? I'm guessing about .75
, comment by MomentsandSeconds
MomentsandSeconds Holds true with my opinion for a long time now. When they're right off of summer tour Dick's is Spectacular. The more days in between the last show of tour and Dick's = more disconnected playing for a few sets until they get their shit together again.
, comment by paulj
paulj @Capt_Tweezerpants said:
Whats the R2 value on this @paulj? I'm guessing about .75
The simple correlation is -0.77, and the adjusted R-square is 0.53. There's only nine observations, which is why I've tried to avoid saying anything about statistical significance.

I think @MOMENTSANDSECONDS has got it right. If Phish come to Dick's as a true tour closer, they are more likely to carry the fire than if they allow a couple of weeks or more to pass.

Now that I think about it, I'm wondering if those early 3.0 tours, with two legs, might provide a good comparison...
, comment by uctweezer
uctweezer @jadedforbin said:
Meh. The band played really well this year. Several jams (Everything, Mercury, Ghost, Gin, Piper) are pretty clearly the best versions of the year so far. So basically, similar to Dicks every other year. It's pretty unreasonable to expect Dicks to have the single best show of the tour every single year (and would be quite unfair to other venues if they did this on purpose). Especially this year given Alpine 3 madness, it was never going to be THAT show, because it already went down at Alpine. Everything > Mercury especially was BOMB.COM. Ratings on this site mean less and less all the time, with people throwing out 1s and 2s just because they weren't in attendance, or want to fluff a different run. Dicks 19 was great. Camden3 was better. Alpine 3 was all-time great. Every show can't be Cam3 or Alp3. that's not how it works.
Is this in response to someone else’s comment, or did you read way more into the graph than I did?
, comment by Xpanding_Man
Xpanding_Man Thank you for this; not surprising except for 2015. Would be interesting to see two charts as someone mentioned above - one for those who attended vs. those that didn't. In fact, it would be interesting to see if attendance tends to affect ratings; I'm sure it does but could go either way. I've heard horror stories about traffic, rain, etc. but listening at home I'm like "this is good!" :)
, comment by deceasedlavy
deceasedlavy Somebody show this to the band! Ha.

If this tells us anything it's that this year's run was really underrated or that Friday really dragged it down. (Personally I think the whole tour was underrated; there were a few dud shows but a bunch of huge ones.) Saturday and Sunday were top-notch in all respects, except maybe the hijinks factor, and who cares about that? I can't really figure out what fans like or don't like these days but I thought the plague run was in the upper half of the Dickses.
, comment by Phishead1
Phishead1 So, people get more disappointed the more time they have to speculate and theorize about what will happen at dicks.... very interesting :)
, comment by EmotionalFescue
EmotionalFescue I think the length of the gap would most affect the first show of the run rather than the average score for the whole run...

9/1/17 has a 4.6 rating and 8/31/18 has a 4.5.
, comment by 90MinuteJam
90MinuteJam Should we add this data to the spurious correlation list? http://tylervigen.com/spurious-correlations />
Like where
@dryicefactory was going... consider
normalizing on the year. Not certain on best way, maybe y is difference to tour average.

Really enjoyed the thread; keep being cool everyone.
You must be logged in to post a comment.
Support Phish.net & Mbird
Fun with Setlists
Check our Phish setlists and sideshow setlists!
Phish News
Subscribe to Phish-News for exclusive info while on tour!


Phish.net

Phish.net is a non-commercial project run by Phish fans and for Phish fans under the auspices of the all-volunteer, non-profit Mockingbird Foundation.

This project serves to compile, preserve, and protect encyclopedic information about Phish and their music.

Credits | Terms Of Use | Legal | DMCA

© 1990-2024  The Mockingbird Foundation, Inc. | Hosted by Linode